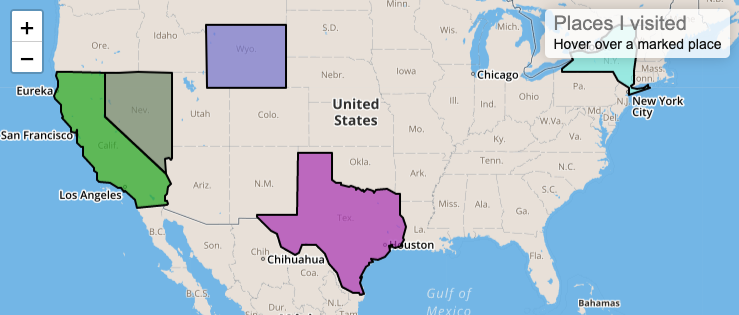
Recently I created an interactive map page of all the places that I visited. This post provides an overview of how to create such interactive map.
Libraries
List of libraries that I used:
- Mapbox - https://www.mapbox.com
- Leafletjs - https://leafletjs.com
First thing we need to do is obtain an access token by signing up for Mapbox. Once you have the token, we are ready to build our first map.
Basic Map with Data Source
Add leafletjs by including these in the head of your HTML code:
<link rel="stylesheet" href="https://unpkg.com/leaflet@1.3.1/dist/leaflet.css"
  integrity="sha512-Rksm5RenBEKSKFjgI3a41vrjkw4EVPlJ3+OiI65vTjIdo9brlAacEuKOiQ5OFh7cOI1bkDwLqdLw3Zg0cRJAAQ=="
  crossorigin=""/>
<script src="https://unpkg.com/leaflet@1.3.1/dist/leaflet.js"
  integrity="sha512-/Nsx9X4HebavoBvEBuyp3I7od5tA0UzAxs+j83KgC8PU0kgB4XiK4Lfe4y4cgBtaRJQEIFCW+oC506aPT2L1zw=="
  crossorigin=""></script>
Add a div tag to the body of HTML code:
<div id='map' style="width:100%; height:100vh;"></div>
Render a map with some overlay. The overlay data are GeoJSON. We will use a sample data (custom.geo.js) as a demonstration.
<script src="https://jtthai.com/assets/js/custom.geo.js" type="text/javascript"></script> // load geojson data
<script type="text/javascript">
var geojson = L.geoJson(countries).addTo(map);
var map = L.map('map').setView([0, 0], 2);
L.tileLayer('https://api.tiles.mapbox.com/v4/{id}/{z}/{x}/{y}.webp?access_token={accessToken}', {
maxZoom: 18,
attribution: 'Map data © <a href="https://www.openstreetmap.org/">OpenStreetMap</a> contributors, ' +
'<a href="https://creativecommons.org/licenses/by-sa/2.0/">CC-BY-SA</a>, ' +
'Imagery © <a href="https://www.mapbox.com/">Mapbox</a>',
id: 'mapbox.streets-basic',
accessToken: // Paste your mapbox access token here
}).addTo(map);
</script>
Here is how it looks in action:
See the Pen Basic Map by Jason Thai (@zirius-the-reactor) on CodePen.
Custom Styling and Interaction
Define a style for our custom overlay with a random fillColor
function getRandomColor() {
  var letters = '0123456789ABCDEF';
  var color = '#';
  for (var i = 0; i < 6; i++) {
    color += letters[Math.floor(Math.random() * 16)];
  }
  return color;
}

function style(feature) {
    return {
        fillColor: getRandomColor(),
        weight: 2,
        opacity: 1,
        color: 'white',
        fillOpacity: 0.7
    };
}
var geojson = L.geoJson(countries, {style: style}).addTo(map);
Add interactions to our map by displaying the color of the areas when we click on them.
geojson.eachLayer(function (layer) {
    layer.bindPopup('<p style="color:' + layer.options.fillColor + '">'  + layer.feature.properties.name +'</p>');
});
Voila! Try clicking on the map and see the result! Now the map looks like this:
See the Pen Basic Map with Color by Jason Thai (@zirius-the-reactor) on CodePen.
Resources
- https://leafletjs.com/examples.html
- https://geojson-maps.ash.ms/
- https://github.com/tmcw/awesome-geojson
Conclusion
Here we create a sample map with interactions using Mapbox and Leafletjs. I encourage everyone to try out and make new maps with your own twist. Looking forward to seeing what you make!